The Public Ledger 04
The Public Ledger — Issue 04
1 October 2026
Portfolio Summary
- Inception Date: 12/02/2026
- Reporting Date: 30/09/2026 (230 days since inception)
- Total Capital Deployed: ₹71,564.80 (net paid, including charges)
- Invested Securities Value: ₹74,866.55 (holdings only, at market prices — excludes cash)
- Cash Balance: 19.4% of total portfolio value (₹18,000 of ₹92,866.55)
- Portfolio XIRR: 16.1%*
- Gain on current securities + dividend: ₹4,680.44 (+6.6%) including ₹1,222 of dividends received; ₹3,458.44 (+4.8%) excluding dividends. Both are measured against the ₹71,408.11 cost of the securities held, before transaction costs.
- Net portfolio gain: ₹4,523.75 (+6.3%) including dividends, measured against total capital deployed of ₹71,564.80. This allows for ₹156.69 of transaction costs and the realised loss on the closed MON100 trade, and is the basis used in the benchmark table below.
- Realised P&L (closed trades): -₹76.03, the MON100 intraday trade of 17/02/2026. No trades were closed during this period.
*Portfolio XIRR reflects the annualised return calculated using the timing and amount of cash flows since the portfolio’s inception. It covers capital deployed into securities only (idle cash is excluded), is net of actual transaction costs, and includes ₹1,222 of dividends received since inception, counted as inflows on their ex-dates and recorded in The Public Ledger.
Note: As the portfolio is still in its early stages (230 days since inception) and has a relatively small capital base, the XIRR may be volatile. Small changes in portfolio value or the timing of cash flows, particularly for capital invested only recently, can have a disproportionate effect on the annualised figure, so it should be read alongside the absolute return. This effect is expected to diminish as the portfolio matures and the capital base grows over time.
Past performance is not indicative of future results.
Since the Last Ledger
This section shows the change in invested securities value since the previous reporting date, separating new purchases from investment performance.
- Previous portfolio value (31/08/2026): ₹68,161.80
- Current invested securities value (30/09/2026): ₹74,866.55 (excludes cash — see Cash Balance above)
- New purchase during the period: ITC, 20 shares, ₹5,314.25 paid including charges (held at ₹5,255.00 at the reporting date)
- Net external capital added / withdrawn during the period: +₹5,314.25
- Investment gain on existing holdings during the period: ₹1,449.75 (+2.1%)
- Dividends received during the period: ₹0
- Other cash movements, if any: None recorded
- Change in portfolio value: +₹6,704.75 (+9.8%), made up of the new ITC position (₹5,255.00) and the gain on existing holdings (₹1,449.75)
The ITC position is valued at ₹5,255.00 (₹262.75 per share), which is ₹59.25 below the ₹5,314.25 paid including charges.
Month in Brief
Reporting period: 01/09/2026 to 30/09/2026.
- One purchase: ITC Limited, 20 shares at ₹265.40 per share on 22/09/2026.
- No other purchases or sales were undertaken during the reporting period.
- No dividend credits were received during the reporting period.
- Invested securities value rose by ₹6,704.75 (+9.8%) over the period, of which ₹5,255.00 is the new ITC position.
- Cash position: ₹18,000, or 19.4% of the total portfolio value of ₹92,866.55 (securities plus cash), per the Zerodha funds view.
Portfolio Dashboard
Below is a snapshot of the portfolio as of the reporting date, including current holdings, allocation and overall composition.
The dashboard is designed to provide a transparent view of where the capital is invested, without requiring readers to refer to the underlying spreadsheet.
| Stock | Units | Avg buy price (₹) | Current value (₹) | Gain / loss (₹) | Gain / loss (%) | Weight |
|---|---|---|---|---|---|---|
| ADANIPORTS | 4 | 1,542.10 | 7,193.20 | +1,024.80 | +16.6% | 9.6% |
| BIRET-RR | 100 | 328.84 | 33,603.00 | +719.00 | +2.2% | 44.9% |
| EIHOTEL | 62 | 304.83 | 18,770.50 | -128.96 | -0.7% | 25.1% |
| HDFCBANK | 1 | 751.75 | 708.70 | -43.05 | -5.7% | 0.9% |
| MON100-E | 21 | 229.50 | 6,744.15 | +1,924.65 | +39.9% | 9.0% |
| Varun Beverages (VBL) | 6 | 429.50 | 2,592.00 | +15.00 | +0.6% | 3.5% |
| ITC | 20 | 265.40 | 5,255.00 | -53.00 | -1.0% | 7.0% |
| Total | 74,866.55 | +3,458.44 | +4.8% | 100.0% |
Price hierarchy: reporting date is 30/09/2026; market prices for all seven holdings, including ITC, are from the Zerodha holdings view dated 30/09/2026. Gain / loss is measured against the cost of the securities held, before transaction costs. Weights are the share of total holdings value (cash excluded).
The table above provides a snapshot of the portfolio at the reporting date. The complete portfolio dashboard, including the underlying calculations and detailed portfolio data, is available on the Portfolio Holdings page.
Benchmarking the Portfolio
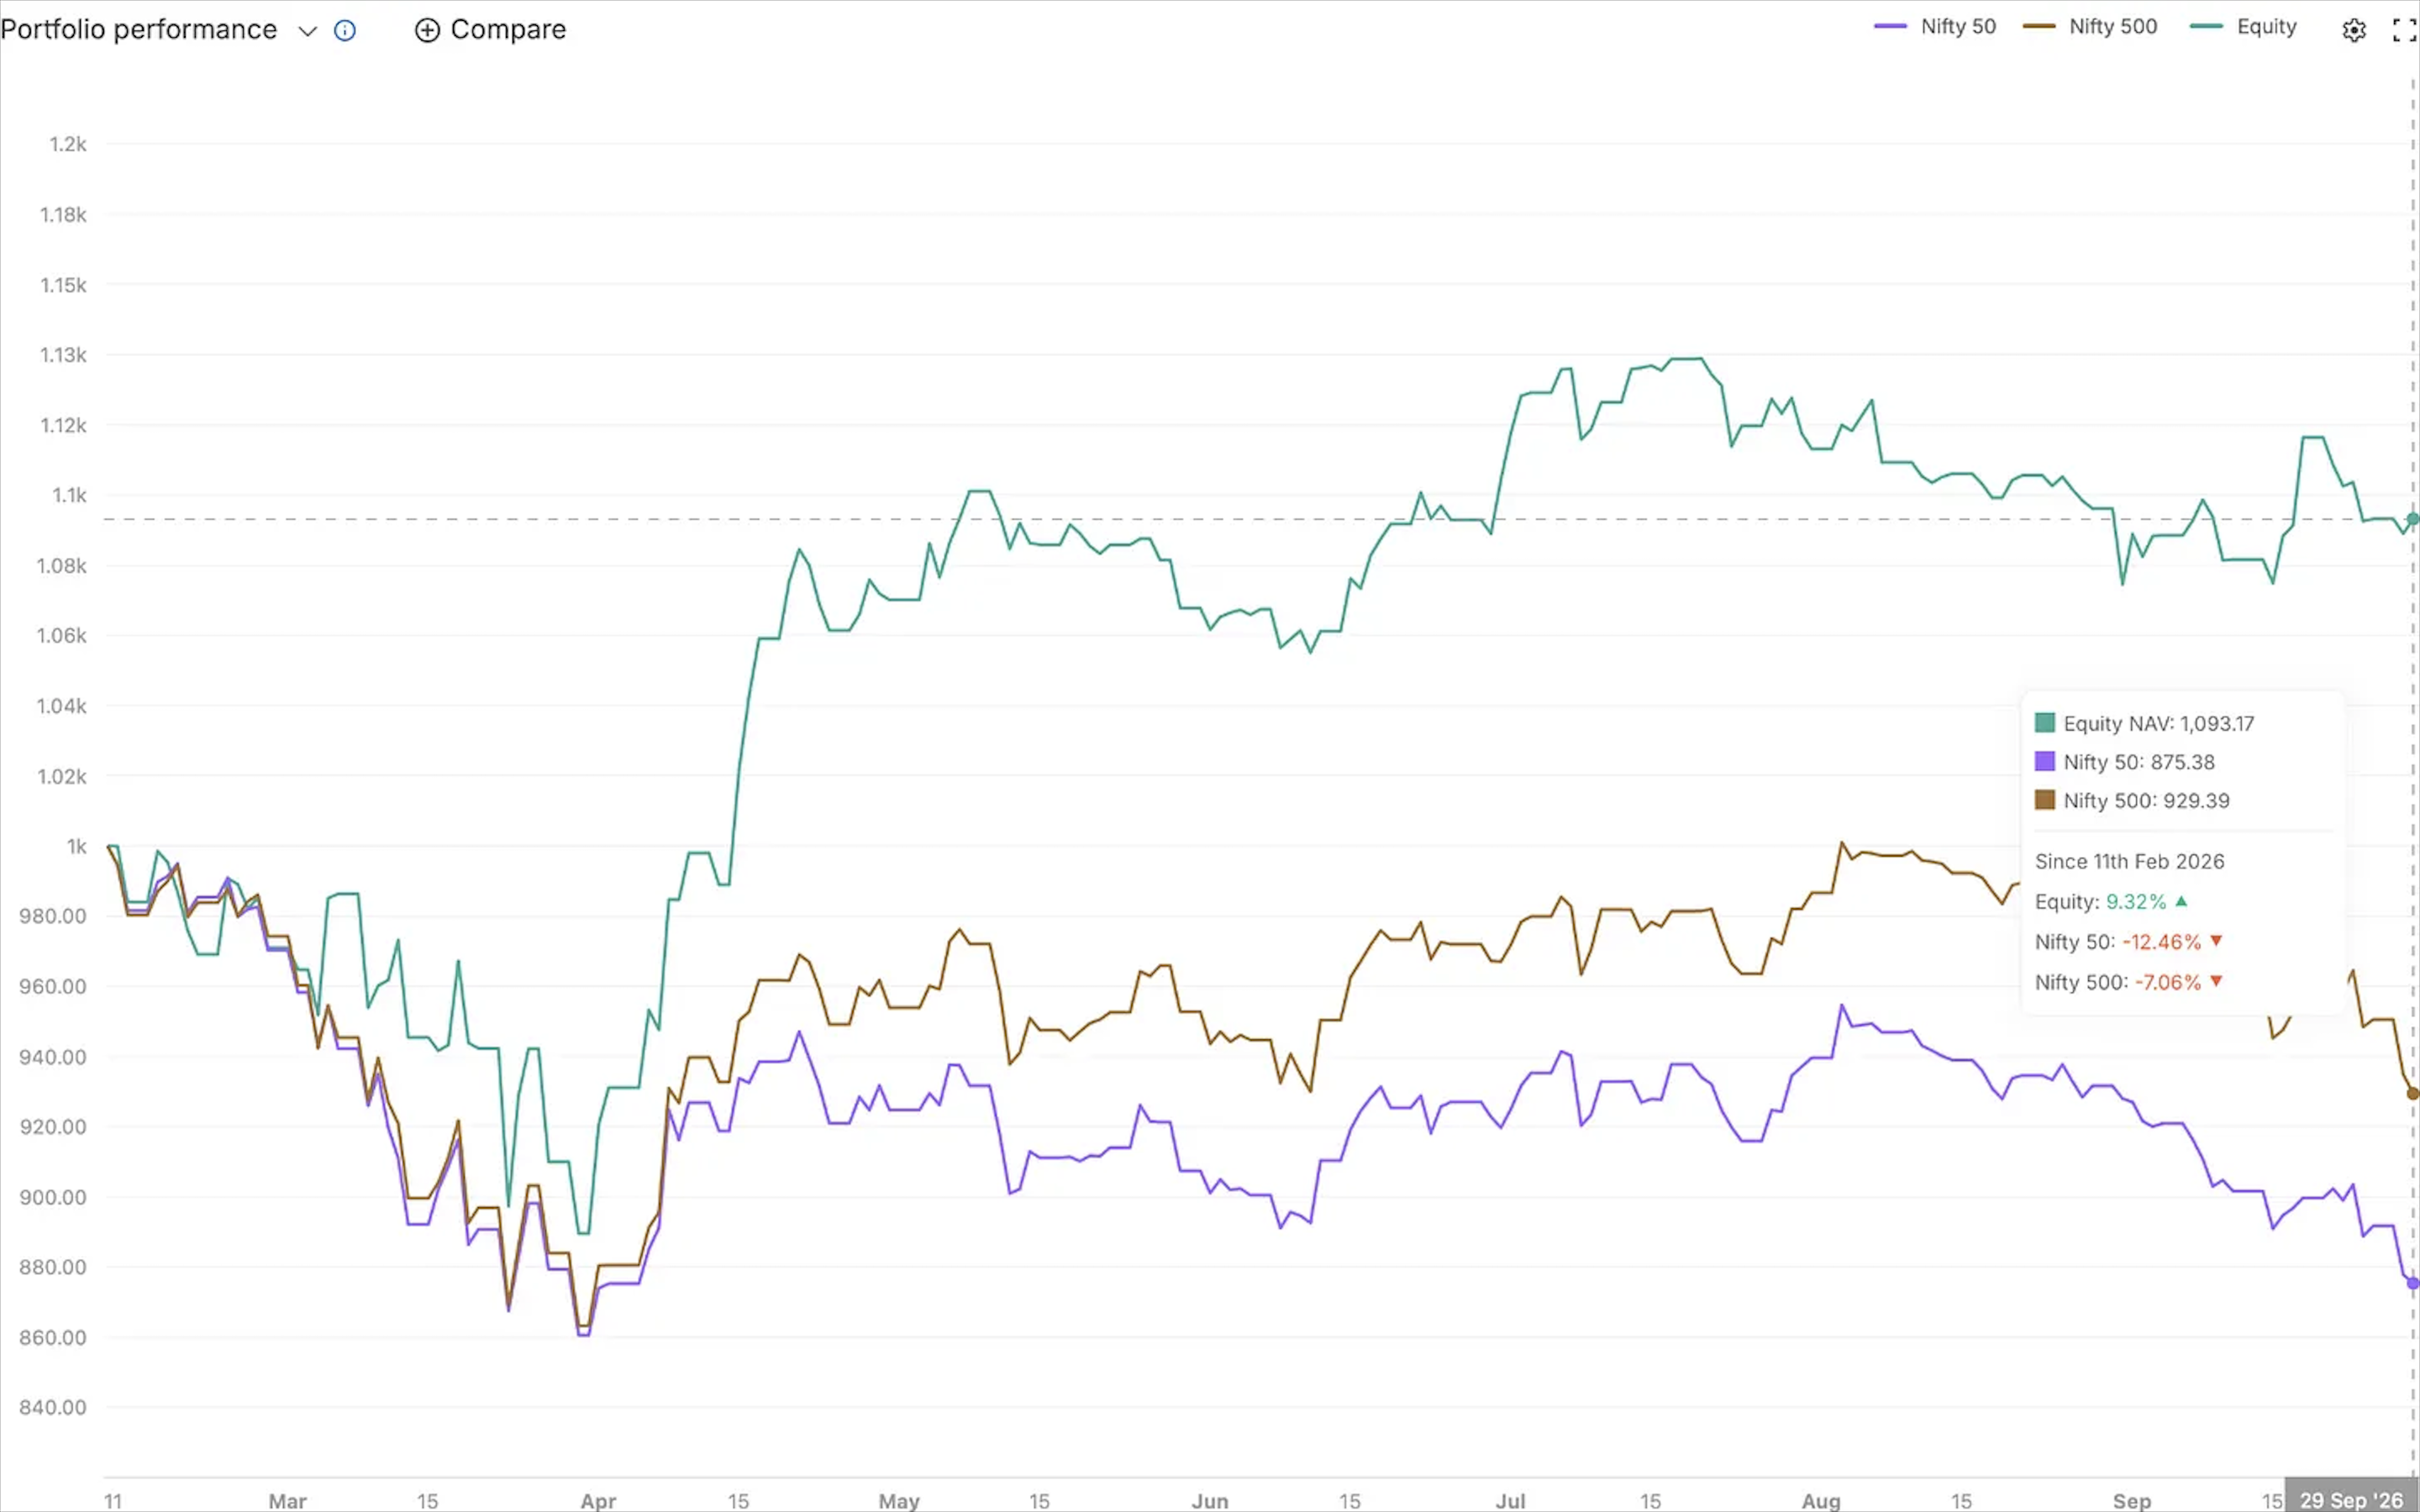
To provide context for the portfolio’s performance, the portfolio is benchmarked against the Nifty 50 TRI and Nifty 500 TRI from inception.
The table below compares the portfolio with the same amounts invested on the same dates in each benchmark.
| Comparison | Invested (₹) | Value today (₹) | Gain / loss (₹) | Absolute return | XIRR |
|---|---|---|---|---|---|
| Arthaay Portfolio | 71,564.80 | 74,866.55 | +4,523.75 | +6.3% | 16.1% |
| Same tranches in Nifty 50 TRI | 71,564.80 | 66,861.85 | -4,702.95 | -6.6% | -15.3% |
| Same tranches in Nifty 500 TRI | 71,564.80 | 69,109.54 | -2,455.26 | -3.4% | -8.1% |
Portfolio gain and absolute return include ₹1,222 of dividends received and are measured against net cash paid including charges (₹71,564.80), so ₹4,523.75 is lower than the ₹4,680.44 in the Portfolio Summary by the ₹156.69 of transaction costs and realised loss. Nifty TRI figures include reinvested dividends. Values are as of 30/09/2026.
The benchmark comparison is intended to provide context rather than serve as a measure of short-term success or failure. As the portfolio is still relatively new, performance differences over a short period may not be particularly meaningful and should be interpreted alongside the longer-term record as the portfolio matures.
Two cautions apply. Portfolio results are net of actual brokerage and taxes, while the index carries no such costs. And annualised figures over 230 days can look extreme (the Nifty 50 TRI shows -15.3% annualised against -6.6% in absolute terms), so XIRR should be read alongside the absolute return.
How this is calculated: each time money was invested in the portfolio, the same amount was hypothetically invested in the benchmark on the same date at that day’s TRI level. All such tranches were then valued at the 30/09/2026 TRI level and combined. This includes the ITC purchase of 22/09/2026 and the ₹76.03 lost on the closed MON100 trade, which is matched on the date the capital left the account. Cash not yet deployed is not assumed to earn the benchmark return. Source: NSE historical TRI data (niftyindices.com). The full method is in the Benchmark Methodology tab of The Public Ledger.
Broker Performance View
Public Ledger
Every figure reported above is drawn from a single source: The Public Ledger, the complete and unedited transaction record of the portfolio.
The Ledger also contains the underlying calculations used to arrive at the XIRR reported in the Portfolio Summary. This provides a complete transaction-level record behind the portfolio figures presented in this publication.
The complete, unedited transaction record, along with the underlying calculations supporting the portfolio figures, is maintained in The Public Ledger.
The Public Ledger is a self-reported, unaudited record prepared from Zerodha contract notes and the trade log. The portfolio is small and concentrated, so results are heavily influenced by individual positions.
Portfolio Observation
The reporting period was marked by heightened geopolitical tensions in the Middle East and elevated oil prices, which contributed to inflation concerns and volatility across global markets. Indian equities remained volatile amid higher oil prices and rising global bond yields, while the U.S. Federal Reserve’s 25-basis-point rate hike on 16 September, its first since 2023, added to uncertainty over the subsequent path of monetary policy.
During the reporting period, I initiated a position in ITC Limited by purchasing 20 shares at ₹265.40 per share on 22 September. This was the only purchase made during the reporting period, with no other purchases or sales undertaken. ITC closed the month at ₹262.75, 1.0% below the purchase price.
Rationale: The recent market correction led me to look for relatively defensive areas, with FMCG being one sector I considered due to the recurring nature of consumer demand. ITC stood out within the sector and my decision is based on its long-term cash-generation potential and dividend-paying capacity. The cigarette business faces higher tax pressure from the higher excise duty in force since 1 February 2026, creating near-term uncertainty around volumes, pricing and margins. I will monitor these factors alongside the growth of ITC’s non-cigarette businesses as the thesis develops.
Concentration and performance: the two largest positions, BIRET-RR (44.9%) and EIHOTEL (25.1%), together make up 70.0% of invested securities value. Of the ₹3,458.44 unrealised gain, ₹2,949.45 comes from MON100-E (+₹1,924.65) and ADANIPORTS (+₹1,024.80), while EIHOTEL, HDFCBANK and ITC are currently below cost.
Portfolio Activity & Decisions
Purchase: I initiated a position in ITC Limited on 22/09/2026, purchasing 20 shares at ₹265.40 per share (₹5,314.25 paid including charges). This is a new position and forms part of the portfolio’s Satellite allocation. At the reporting date it was valued at ₹5,255.00 (₹262.75 per share).
Dividends: No dividend credits were received during the reporting period. Total dividends received since inception are ₹1,222, and the complete record is maintained in The Public Ledger.
Other activity: No other trades were executed during this reporting period, and no positions were sold. The only realised result since inception remains the ₹76.03 loss on the MON100 intraday trade of 17/02/2026, which is recorded in The Public Ledger. Existing positions across the Core and Satellite allocations remain otherwise unchanged from the last reporting date.
Cash position: 19.4% (₹18,000)
I haven’t confirmed any other new positions at this stage. Any further deployment will be recorded in The Public Ledger as part of the ongoing public record, rather than announced after the fact.
Thesis Check
ITC (new position, 22/09/2026): My thesis is a long-term view on the business’s cash generation. I am tracking the effect of the higher excise duty on cigarette volumes and margins, ITC’s ability to pass on price increases, and the growth of its non-cigarette businesses. As the position was opened only eight days before the reporting date, no thesis change is being reported.
Existing holdings: No material thesis change is being reported for the period.
Looking Ahead
With markets likely to stay volatile in the near term, I remain focused on deploying capital selectively rather than reacting to short-term market movements.
The remaining cash allocation is intentional and will be deployed when opportunities align with the portfolio’s existing investment framework and valuations become favourable.
The portfolio will continue to be documented through The Public Ledger.
The next Research Note will examine Amber Enterprises Ltd. in greater depth, covering its business, industry positioning, growth drivers, financial performance, valuation and key risks.
This publication exists to answer one question every month: what actually happens to this money, and why? Not a forecast. Not a hot take. A running, verifiable record of the decisions, transactions and mistakes along the way — and one investor’s attempt to compound capital with discipline over a long horizon.
— The Investor Behind Arthaay
Disclaimer: Arthaay is an independent publication. The Public Ledger records the author’s own portfolio and is not investment advice or a recommendation to buy or sell any security. Where a stock discussed here is also held in the author’s personal or family portfolios, this is disclosed. Past performance is not indicative of future results.