Research Note 04 · AMBER
The Hidden Company Inside Your Electronic Devices
15 October 2026
Arthaay Research Note | Company, capital allocation and execution
Cut-off: 12 October 2026. Financials use FY2026 audited results and Q1 FY2027 disclosures unless noted. Market ratios are snapshots dated 1–9 October 2026. No price forecast, fair-value estimate or buy/sell recommendation is provided.
We use electronic gadgets every day, but the brand on the box is not always the manufacturer. Amber Enterprises Ltd. interests me because it has moved from air-conditioners into components, electronics manufacturing and railway systems. The question is whether those capabilities can earn an adequate return on the capital committed.
Verdict
Constructive on Amber’s strategy, conditional on financial delivery. FY2026 revenue and operating EBITDA grew about 22%, but cash flow and returns on capital weakened while the company expanded.
FY2026 in numbers
Revenue ₹12,186 cr (+22%) · Operating EBITDA ₹970 cr (+22%) · Reported PAT ₹226 cr (−10%) · Operating cash flow ₹240 cr against capex of ₹1,295 cr · Provider ROCE 7.9% (14.0% in FY2025)
What to watch
Cash conversion and inventory days · returns on the PCB and electronics build-out · leverage (management net debt ₹511 cr in March 2026, ₹1,225 cr in June 2026) · PCB margin recovery from Q3 FY2027 · IL JIN fire insurance recovery
Publication status
Arthaay is an independent educational publication and is not registered with SEBI as a Research Analyst or Investment Adviser. This note uses publicly available information and is not personalised investment advice. As of 12 October 2026, neither I nor the portfolios I manage hold Amber Enterprises.
Central question
Can Amber turn the manufacturing capabilities it has built into sustainable profitability, stronger cash generation and attractive returns on capital?
My initial view in brief
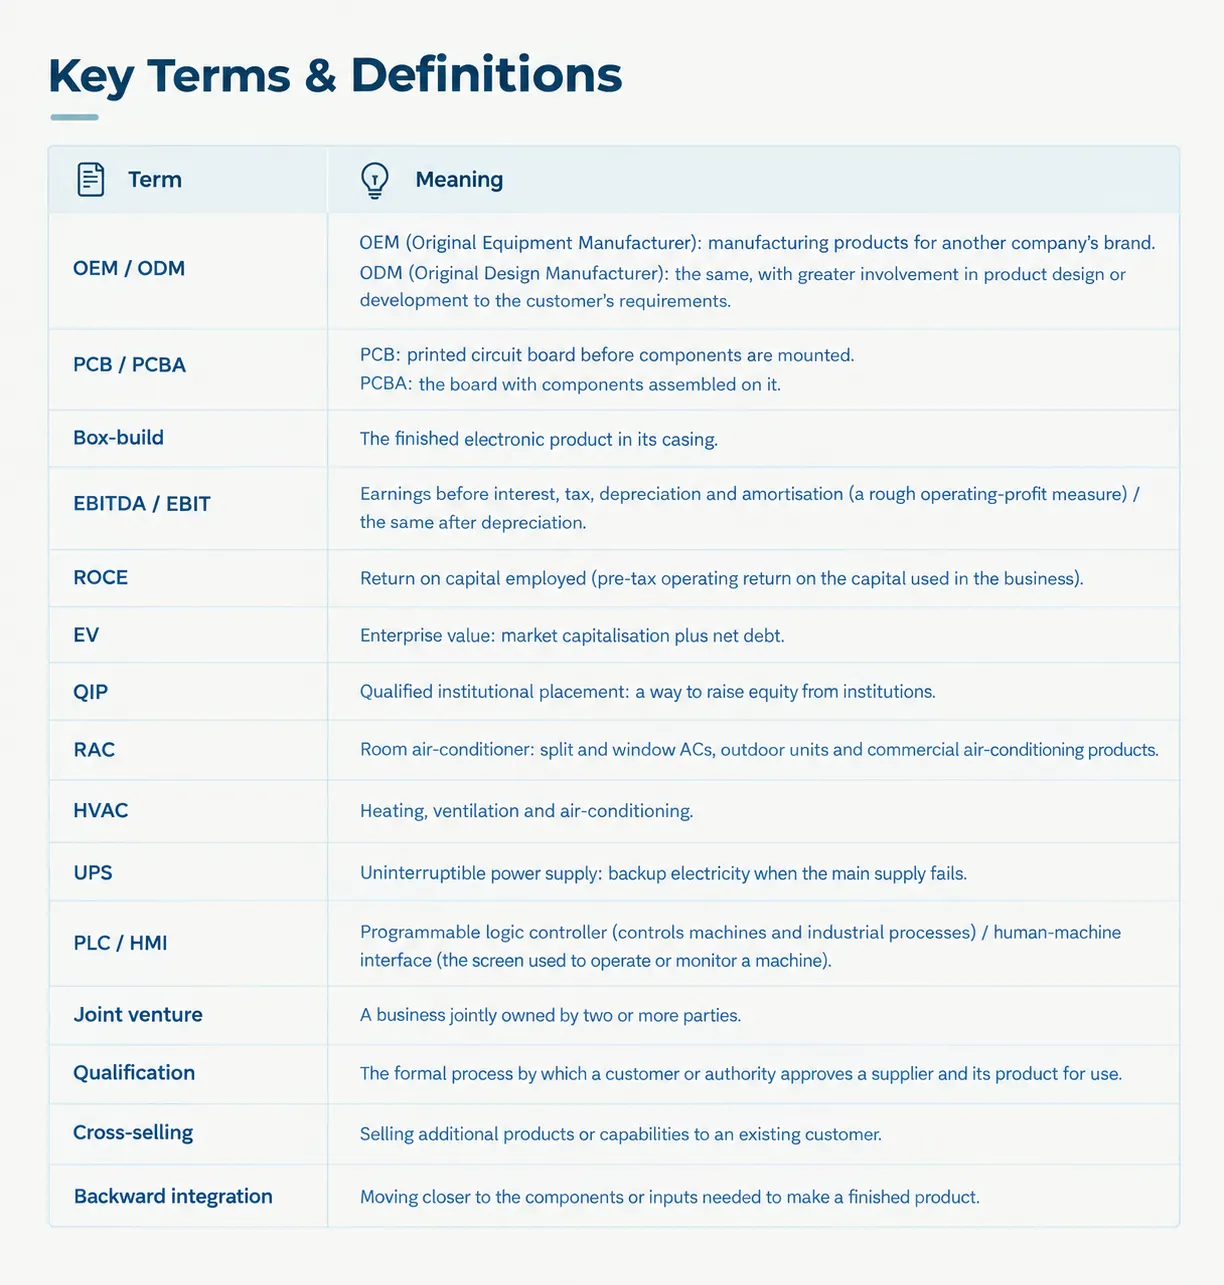
I am constructive on Amber’s strategy: it has built a credible manufacturing platform across air-conditioners, electronics and railway systems. That view is conditional on financial delivery, because FY2026 cash flow and returns on capital weakened while the company expanded. Technical terms are explained in Appendix B.
What Amber does today
Amber is still best known for air-conditioners, but that is no longer a complete description.
Its business now has three divisions. Consumer Durables supplies room ACs and related components, largely on an OEM/ODM basis. Electronics spans PCBA and box-build, bare PCBs, power electronics and industrial automation, with applications in automotive, telecom, energy and industry. Railway Sub-systems & Defence supplies HVAC, controllers, pantry systems, doors, gangways and other specialised rolling-stock products, alongside selected defence and specialised-cooling applications. [5]
These divisions have different customers, demand cycles, margins and capital needs. The link I see between them is manufacturing capability: Amber is trying to apply skills and customer relationships developed in one area to adjacent products and markets.
How the platform was built
Amber did not build this platform through acquisitions alone. Before its major deals, it had developed capabilities in sheet metal, heat exchangers, injection moulding, condensers and motors. PICL added motor manufacturing; IL JIN and Ever added PCBA and electronics assembly. [1][14]
Sidwal, acquired in 2019, took Amber into railway, metro, bus and defence HVAC. The business later expanded into controllers, pantry systems, doors and gangways. Wallet share per passenger coach rose from 4% in FY2020 to 18% in FY2025, evidence of a broader product offering to customers, but not proof that every new product will deliver attractive returns. [1][15]
Amber then deepened its electronics capabilities. Ascent added bare-PCB manufacturing, Korea Circuit brought access to advanced PCB technology through a joint venture, and Shogini broadened PCB capability and customer reach. Power-One added UPS systems, solar inverters and EV chargers; Unitronics added PLCs and HMIs. [16]–[19][24] Newer initiatives in wireless connectivity, medical and defence electronics, and mobile manufacturing are opportunities, not yet evidence of established financial success. [5][6]
The strategic logic makes sense to me: capabilities built for consumer durables may be reused in adjacent industries. But strategic adjacency is not the same as proven economic integration. I found no cross-selling revenue or cost savings between the divisions in the disclosures reviewed. Diversification creates value only if these businesses can grow profitably, generate cash and earn adequate returns on the capital invested.
The three engines
The FY2026 audited segment results are a useful starting point, not because they tell the whole story, but because they show how differently the three divisions currently earn money. [2]
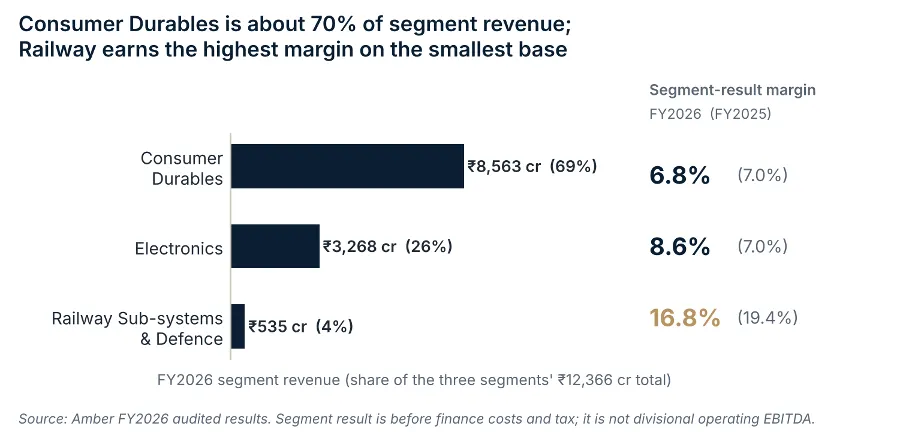
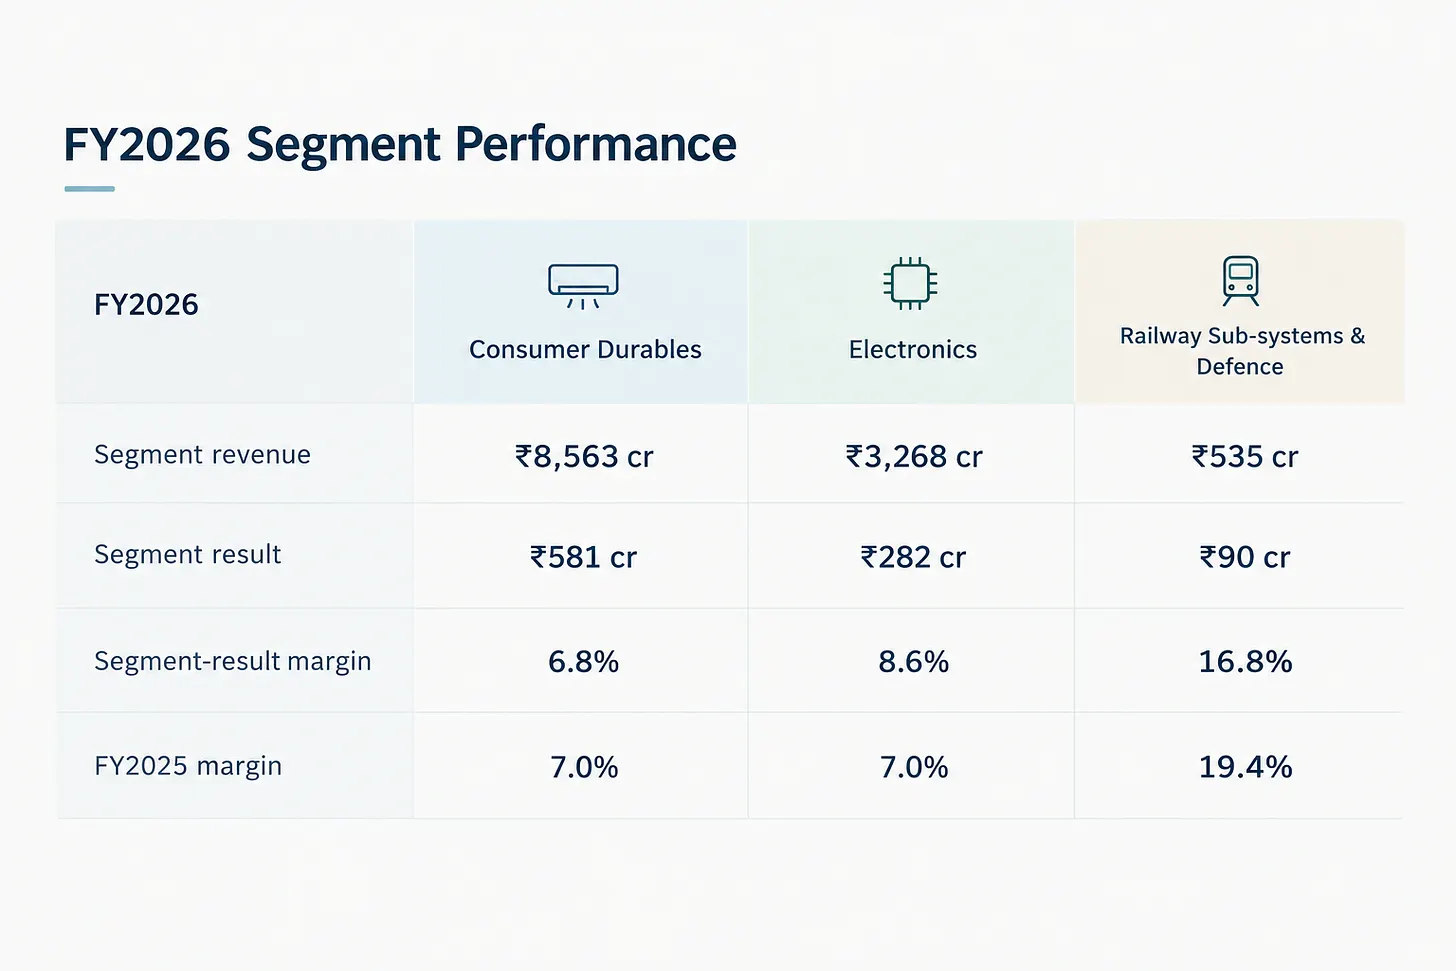
Source: Amber FY2026 audited results. Segment result is before finance costs and tax and is not the same as divisional operating EBITDA. The three segments sum to ₹12,366 cr against consolidated revenue of ₹12,186 cr; the ₹180 cr difference (derived by me) is presumably inter-segment eliminations and should be confirmed against the segment note. [2]
Consumer Durables
Consumer Durables remains the foundation. Amber says it can supply around 70% of a room AC’s bill of materials, and CRISIL estimated its share of the Indian room-AC market at 26–27% in FY2025. That points to scale and customer relationships, rather than consumer-brand ownership, as the division’s main strengths. [5][8]
Q1 FY2027 Consumer Durables segment revenue was about ₹2,803 crore, up 8.2% year on year. That was below management’s cited FY2027 room-AC industry growth expectation of 13–15%, though one quarter is not enough to judge the full year. The investor presentation separately reports divisional revenue of ₹2,758 crore alongside divisional operating EBITDA, so I keep those two reporting series distinct. On the divisional basis the three divisions add up to the consolidated figure (₹2,758 cr + ₹985 cr + ₹144 cr = ₹3,887 cr against ₹3,888 cr). [4][5][6]
The vulnerability is seasonality and concentration. CRISIL estimated that room ACs and components accounted for around 73% of group revenue in FY2025. Weather, channel inventories and customer orders can therefore affect factory utilisation and the cash tied up in working capital. [8]
Electronics
Electronics is the division I would watch most closely for a change in Amber’s long-term business mix. In Q1 FY2027, revenue rose 29% year on year to ₹985 crore and divisional operating EBITDA rose 117% to ₹107 crore, taking margin from 6.4% to 10.8%. That is encouraging, but acquisitions affect the comparison, so it is not a clean measure of organic growth. [5]
The next test is whether investment in PCBs, power electronics and automation earns an adequate return. Management said bare-PCB margins were around 12%, versus a typical 16%, after copper-clad laminate costs rose. It expects recovery towards 15–16% from Q3 FY2027 if input costs stabilise and price increases are passed through. That remains a management expectation to test against subsequent results. [5][6]
Railway Sub-systems & Defence
This division has specialised products and customer-qualification barriers, but Q1 FY2027 also showed how quickly margins can come under pressure. Revenue grew 18% to ₹144 crore, while operating EBITDA fell 26% to ₹16 crore and margin declined from 17.9% to 11.3%. Management cited product mix, copper inflation, currency movements and wage revisions. [5][6]
Order visibility is not the same as revenue earned or margin secured. Project delays, approvals, fixed-price contracts and product mix will determine whether this division turns its specialised capabilities into sustained returns.
My reading
I see a credible manufacturing platform taking shape at Amber. The company has progressively added components, electronics, specialised HVAC and adjacent product capabilities, generally building from an existing skill set rather than collecting unrelated businesses. [1][14]–[19]
My view is constructive on the strategy, but conditional on financial delivery. FY2026 revenue and operating EBITDA each grew about 22%, yet operating cash flow fell to ₹240 crore, capex rose to ₹1,295 crore, inventory days increased from about 55 to 75, and provider-calculated ROCE declined from 14.0% to 7.9%. The business is expanding; the financial evidence has not yet shown that this expansion is creating value at the same pace. [2][9]
- What I find attractive: Amber’s established room-AC position, backward integration, a fast-growing Electronics platform, specialised Railway Sub-systems & Defence capabilities and supportive domestic manufacturing policy. [5][8][13]
- What concerns me: capital intensity, weak cash conversion, rising finance costs, minority interests in IL JIN, the audit qualification and a valuation that already requires strong future execution. [1][2][4][5]
- What needs to be proven: newer facilities and acquisitions must translate into better cash flow, tighter working capital, higher returns on capital and earnings that accrue to Amber shareholders over the next two to three years. [2][5][9]
The sections that follow test this reading against the evidence.
Methodology and definitions
I keep four kinds of figure separate, because they are not interchangeable: audited results, company segment figures, management’s divisional operating EBITDA, and third-party standardised ratios. [2][5]
- Operating EBITDA is the measure Amber Enterprises Ltd. uses for its divisions before ESOP expense and other non-operating items. Management has said these divisional figures are not directly comparable with the published segment results.
- Provider ratios (StockAnalysis, Screener) are compared only within the same series. Where I show several versions of one ratio, the differences come from definitions (debt, leases, deposits, minority interests, EBITDA series) and dates, and none should be mixed with another.
- Guidance and market snapshots are not forecasts or recommendations.
Financial performance
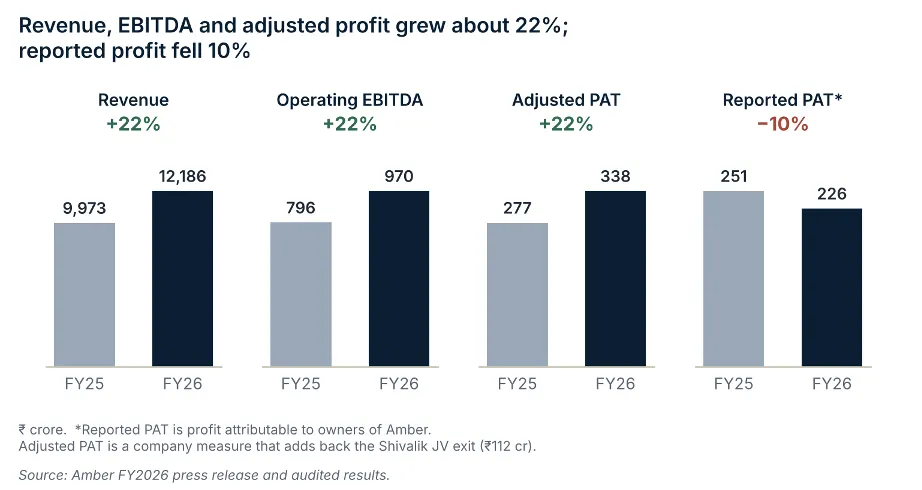
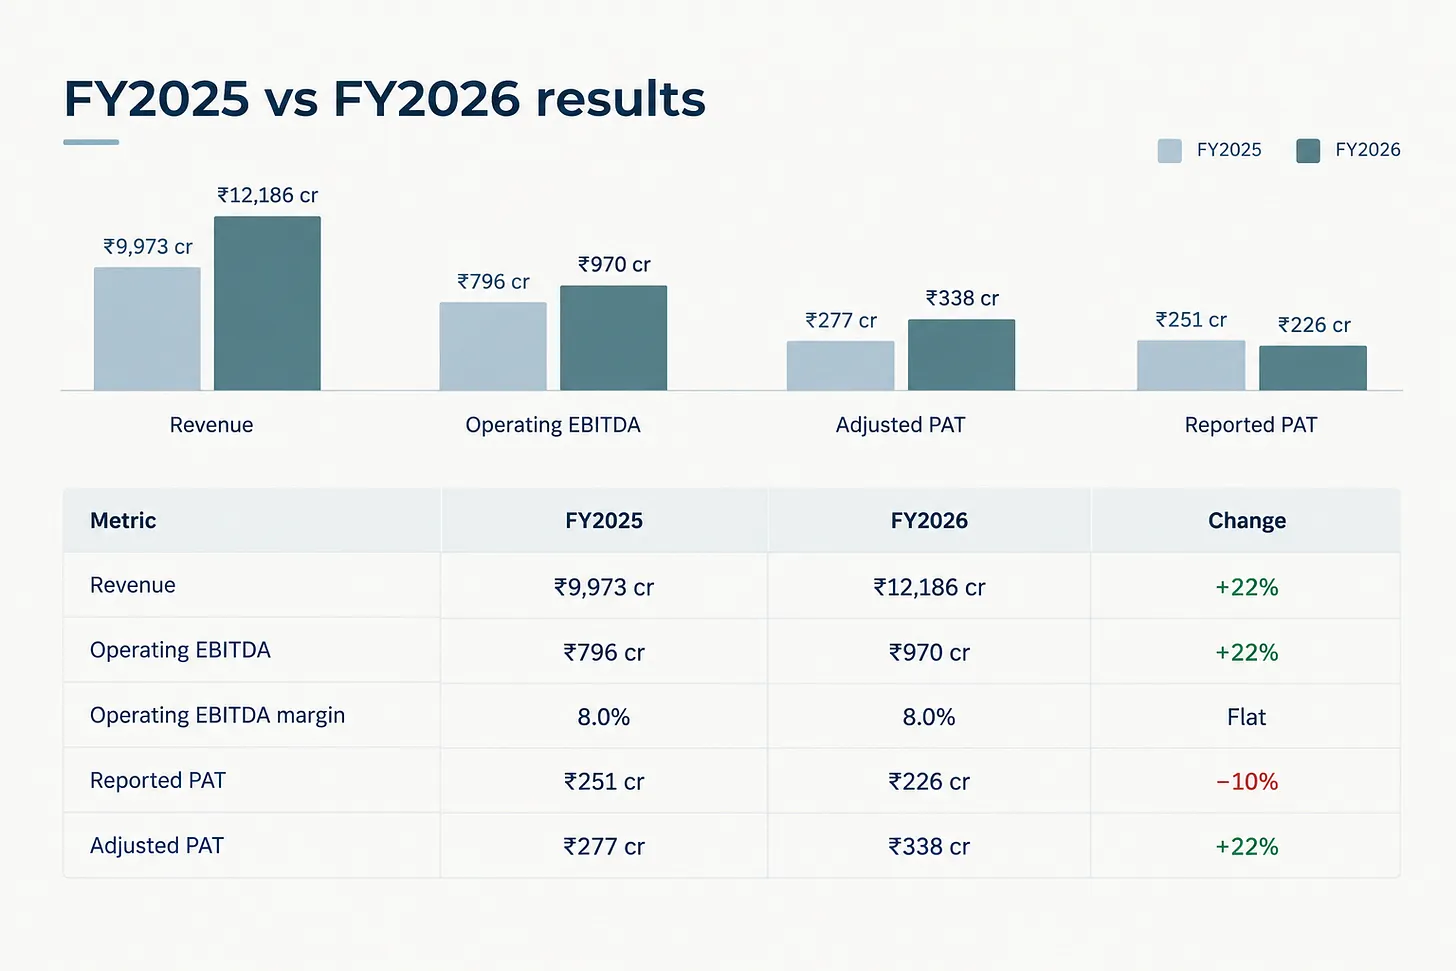
Source: Amber FY2026 press release and audited results. The Reported PAT figure of ₹226 crore for FY2026 is the profit after tax attributable to the owners of Amber Enterprises. Adjusted PAT is a company measure and should not replace reported PAT. [2][3][21][23]
Management reports adjusted PAT of ₹338 crore, which adds back a ₹112 crore impact from the Shivalik joint-venture exit to reported PAT of ₹226 crore. The audited notes show this as ₹81.94 crore of Shivalik-related joint-venture losses plus an impairment of about ₹30 crore. Any other joint-venture losses are not part of the add-back and stay in reported profit. [2][3][21][23]
The headline growth did not flow through to reported profit. Finance costs rose from about ₹209 crore to ₹284 crore, depreciation increased from about ₹228 crore to ₹323 crore, and joint-venture losses and the Shivalik impairment weighed on earnings. [2][3]
Cash flow and capital efficiency
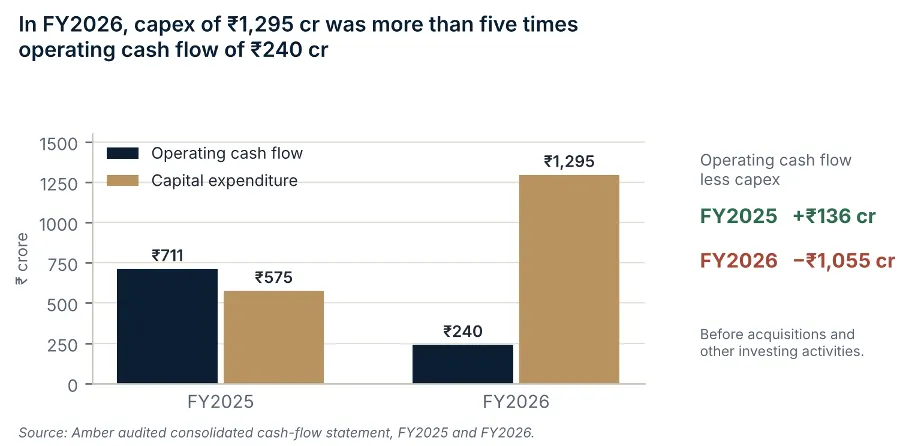
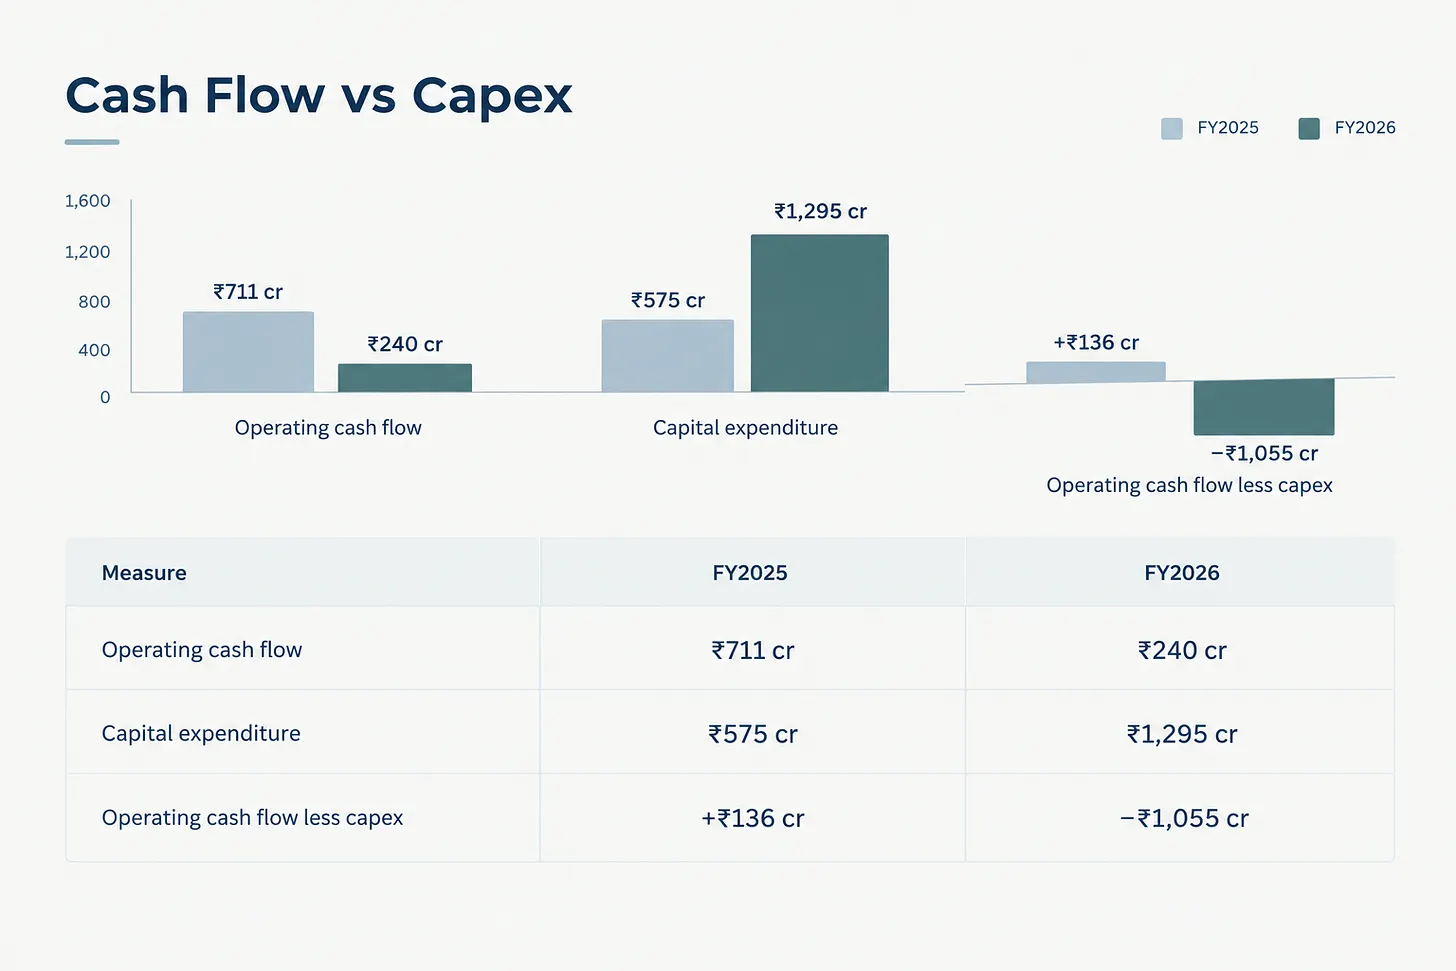
Calculated from Amber’s audited consolidated cash-flow statement. This is a simple free-cash-flow measure before acquisitions and other investing activities. [2]
Working capital. Inventory rose about 48%, from roughly ₹1,655 crore to ₹2,452 crore, and trade receivables rose about 28%, from roughly ₹1,750 crore to ₹2,246 crore, against revenue growth of 22%. Acquisitions account for part of this, but the exact organic versus acquired breakdown for these balances is not explicitly isolated in the annual report, though the overall working capital cycle expanded from 9 days to 29 days. Even so, more cash is now tied up in inventory, receivables and expanding capacity. The question is whether this is temporary investment ahead of growth or a persistent weakness in cash conversion. [2]
Returns on capital. Provider-calculated ROCE fell from about 14.0% in FY2025 to 7.9% in FY2026, while inventory days rose from roughly 55 to 75. A separate calculation using FY2026 EBIT of about ₹750 crore over net worth plus borrowings and lease liabilities of about ₹7,074 crore gives roughly 10.6%, close to Screener’s 10.3%. [2][9][20]
Year-end capital employed also includes capital that is not yet earning. As an illustrative sensitivity only, remove the roughly ₹1,330 crore of deposits, bonds and other treasury assets netted in management’s debt figure (Appendix A, based on the audited notes) from capital employed, and remove about ₹102 crore of other income (EBITDA including other income of ₹1,072 crore less operating EBITDA of ₹970 crore, derived) from EBIT. That gives (750 − 102) ÷ (7,074 − 1,330) ≈ 11.3%. This does not strip out capital work-in-progress or use average capital, both of which would change the picture further. Whichever consistent method is used, returns are under pressure while the capital base is expanding.
Earnings attribution, EBIT and interest cover
In Q1 FY2027, consolidated profit was about ₹44.5 crore, of which approximately ₹41.8 crore was attributable to Amber equity holders and ₹2.7 crore to non-controlling interests. Amber owns about 60% of IL JIN, so IL JIN’s consolidated revenue and EBITDA do not all accrue to Amber shareholders. [1][4][5]
On the Q1 FY2027 consolidated statement, EBITDA including other income was about ₹360 crore. After depreciation and amortisation of roughly ₹108 crore, EBIT was about ₹251 crore against finance costs of around ₹85 crore, implying EBIT interest cover of roughly 3.0×. [4]
For FY2026, EBITDA including other income was about ₹1,072 crore. After depreciation and amortisation of about ₹323 crore, EBIT was approximately ₹750 crore against finance costs of ₹284 crore, implying interest cover of roughly 2.6×. That is not immediately alarming, but it is not a large cushion for a company expanding capex while working capital is absorbing cash. [2]
Balance sheet and funding
Amber has funded expansion through a roughly ₹1,000 crore gross parent-level QIP in FY2026, IL JIN capital raises and borrowings. [2][5]
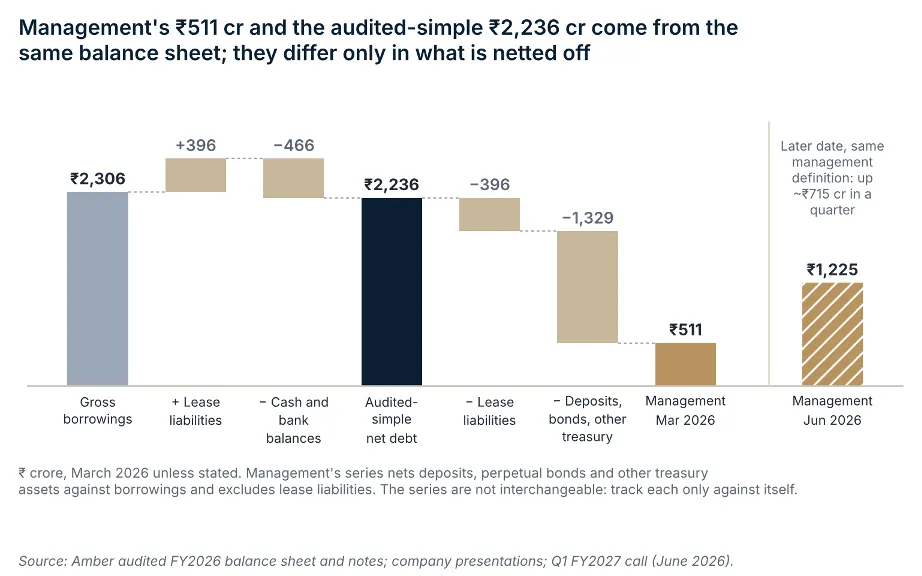
Debt can be measured several ways, and the figures should not be added or treated as one series. I use management’s definition, which nets cash, fixed deposits, bank perpetual bonds and other liquid treasury assets against borrowings and excludes lease liabilities, as my main tracking series: about ₹511 crore at March 2026, rising to about ₹1,225 crore at June 2026, an increase of roughly ₹715 crore in one quarter that the CFO attributed to expansion and acquisitions. [5][6][22] A simple calculation from audited balance-sheet lines (borrowings plus leases less cash and bank balances, with no netting of deposits or bonds) gives about ₹2,236 crore at March 2026, or about 2.31× FY2026 operating EBITDA. A provider series gives 1.60× net debt/EBITDA for FY2026 and about 2.24× in the October 2026 snapshot. [2][9] The chart below shows how the first two reconcile; the full bridge is in Appendix A.
Capex pipeline, guidance and funding
Management has described PCB projects of about ₹3,200 crore at Jewar, ₹1,000 crore at Hosur and ₹500 crore at Pune, alongside mobile manufacturing with OPPO, OnePlus and Realme and later AC/HVAC plants in Uttar Pradesh. The stated timing varies by project; these should be treated as forward-looking commitments, not completed capacity or secured returns. [5][6]
PCB projects funding. The PCB projects alone total about ₹4,700 crore, against FY2026 operating cash flow of ₹240 crore and trailing operating EBITDA of about ₹1,040 crore. That scale difference makes funding, utilisation and any dilution central to the thesis. Government incentives under the Electronic Component Manufacturing Scheme could reduce the net funding requirement; for the Ascent-K Circuit facility, the company is eligible for a 25% capex incentive alongside turnover-linked incentives of 8/7/7/6/5/4% over six years. Since the net funding depends on production milestones, I show the gross capital investment figure. [2][5][6][13][25]
FY2027 guidance versus Q1 evidence
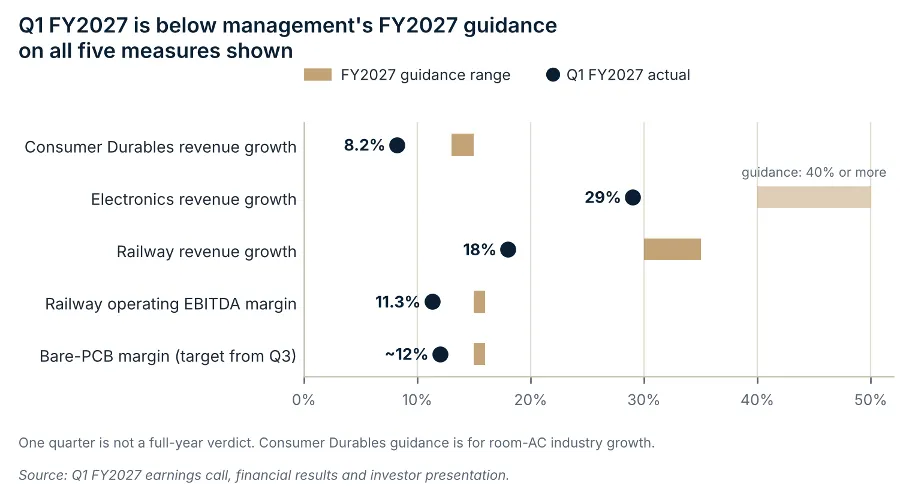
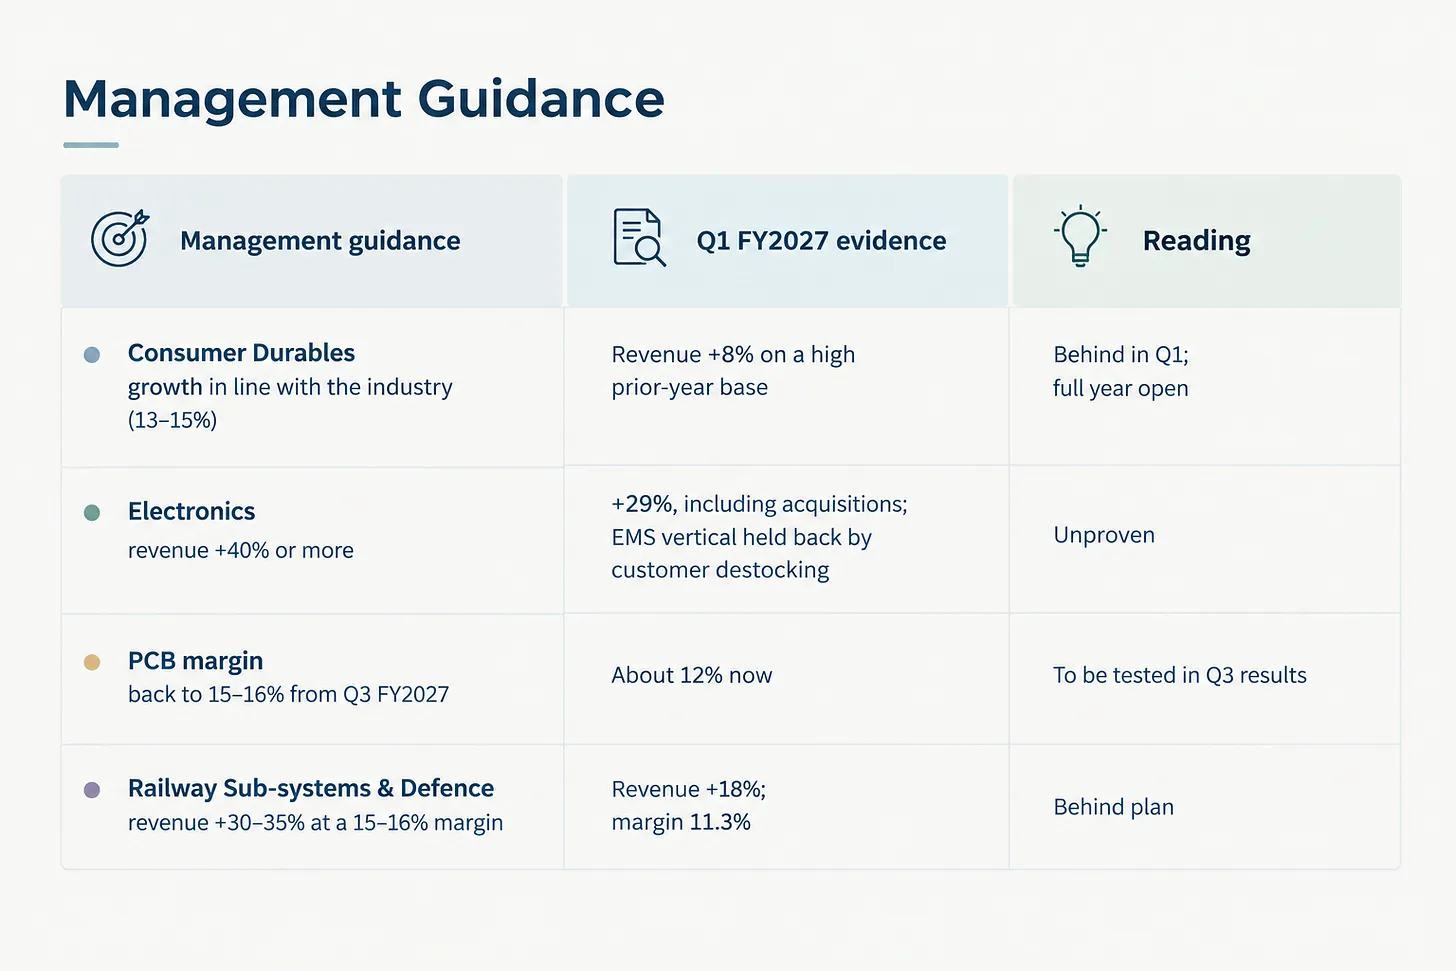
Source: Q1 FY2027 earnings call and financial results. [4][6]
Latest quarter and audit qualification
Q1 FY2027 performance. Q1 FY2027 consolidated revenue was about ₹3,888 crore, up 13% year on year; operating EBITDA rose 28% to about ₹337 crore and adjusted PAT rose 19% to ₹126 crore, the figure attributable to Amber’s owners. Reported consolidated profit was only about ₹44.5 crore (₹41.8 crore to Amber’s owners and ₹2.7 crore to non-controlling interests) because of an exceptional loss of about ₹123 crore. That ₹123 crore is a gross line before tax and minority effects, so it cannot be subtracted directly from adjusted PAT to reproduce reported profit. On my numbers, EBIT of about ₹251 crore less finance costs of about ₹85 crore gives about ₹166 crore of profit before tax and before the exceptional item. This note does not rely on any single component of the exceptional line. [4]
Audit qualification. The FY2026 consolidated accounts received a qualified audit opinion because the financial information of one subsidiary and one joint venture was unaudited. The auditor’s report explicitly confirms that the joint venture in question is Shivaliks Mercantile Limited, which was divested on 30 March 2026. Management noted that the qualification was not expected to significantly affect reported figures, but that statement does not replace the auditor’s qualification. [1][2][21][23]
IL JIN facility fire. A fire occurred on 4 August 2026 at the Greater Noida facility of Amber’s material subsidiary, IL JIN Electronics (India) Limited. Because this incident took place after the 30 June quarter-end, its financial impact is not included in the Q1 FY2027 results and will first appear in Q2 FY2027 or later. Amber formally estimated the loss at ₹38.28 crore plus applicable GST and filed an insurance claim; the insurer has made an interim ad-hoc payment of ₹10 crore, with the balance remaining subject to final assessment. The net impact depends on recovery, restoration and any business interruption, so the loss cannot be assumed to be fully neutralised. [10]
Capital allocation and governance
I see a consistent logic in Amber’s acquisitions: most connect to existing capabilities or provide a defined entry into another manufacturing platform. PICL, IL JIN/Ever and Sidwal are more established parts of the group; Ascent, Korea Circuit, Power-One, Unitronics and Shogini still need to demonstrate that the capital invested will earn adequate returns. [1][16]–[19]
Shivalik is a useful caution. A strategically related investment can still disappoint: Amber reported impairment and joint-venture losses, and Sidwal subsequently exited the investment. I therefore judge strategic fit and financial success separately. [1][2]
Promoter and promoter-group ownership was 38.09% at 30 June 2026, with no pledged shares. FY2026 related-party transactions were stated to be in the ordinary course and at arm’s length; the September 2026 AGM also approved prospective related-party transactions involving IL JIN, Ascent Circuits and Ascent-K Circuit. These are areas to monitor through disclosures rather than infer a governance problem from approvals alone. [1][5][7]
Management also referred to an enabling authorisation to raise up to ₹5,000 crore, but the quantum and form were undecided on the call. This is permission to raise capital, not evidence that the amount has been raised. A raise at IL JIN level could dilute Amber’s roughly 60% stake in IL JIN; a parent-level raise could dilute Amber shareholders. [5][6]
Competitive advantages
- Established RAC position: CRISIL estimated Amber’s Indian room-AC share at 26–27% in FY2025. Customer relationships, integrated manufacturing and plant locations help, but they do not remove customer bargaining power. [8]
- Backward integration: capabilities across sheet metal, heat exchangers, motors, moulding, PCBA and bare PCBs may simplify customer sourcing. The benefit is real only if it improves cost, quality, reliability or customer retention. [5]
- Customer proximity and qualifications: plant locations and technical approvals matter in railway products and advanced electronics, but do not by themselves guarantee pricing power. [5][8]
- Capability reuse: electronics capabilities may serve automotive, telecom, energy and industrial markets as well as consumer durables. I would look for evidence in incremental sales, utilisation, savings and returns, not simply the presence of adjacent businesses. [5][16]–[18]
- Policy support: the ₹40,000 crore Electronic Component Manufacturing Scheme supports domestic component manufacturing, but competitors can benefit too. It is an opportunity, not a company-specific moat. [13]
Valuations
The peer ratios below are snapshots dated 1–9 October 2026 (Screener and StockAnalysis). Amber, Dixon and PG Electroplast differ in business mix, margins, growth, leverage and capital intensity, so I use the comparison as context rather than a like-for-like ranking. [9][11][12]
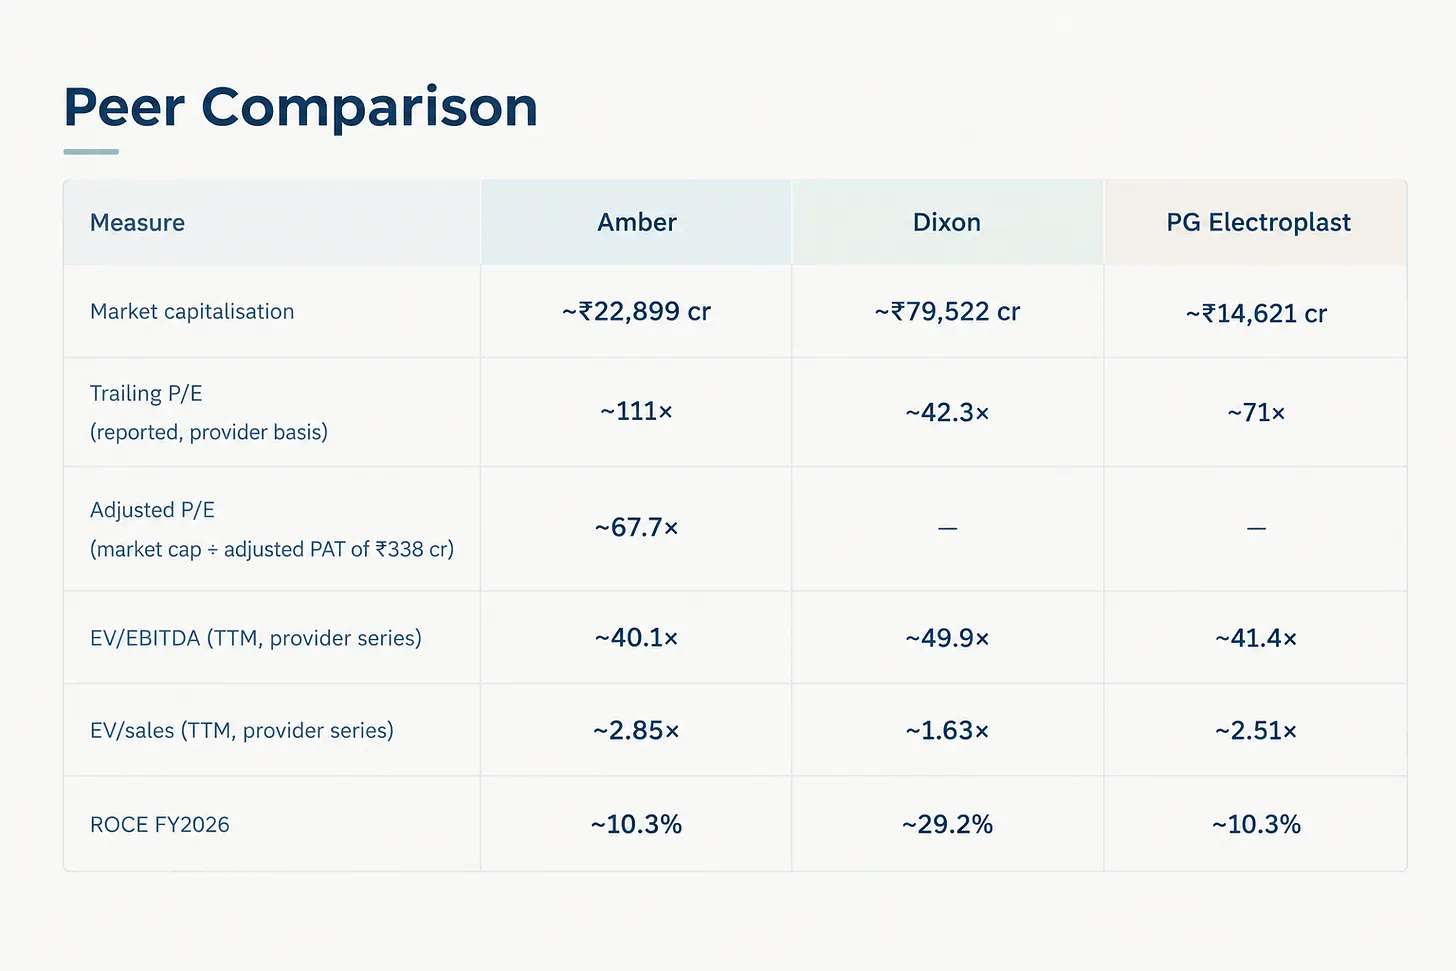
Sources: StockAnalysis and Screener snapshots. Amber and Dixon ROCE are on the StockAnalysis basis with Screener alongside. [9][11][12][20]
Valuation multiples cross-check. Amber’s reported trailing P/E is distorted by unusually low reported earnings after exceptional items, so I also show a P/E on adjusted PAT. EV/EBITDA is a more useful operating cross-check, but it depends on how debt, leases, deposits and minority interests are treated in enterprise value, and on which EBITDA series is used. [2][5][9]
Two ways to compute Amber’s EV/EBITDA. The provider’s 40.1× EV/EBITDA and 2.85× EV/sales together imply an enterprise value of about ₹36,000 crore (2.85× trailing sales of about ₹12,600 crore) and an EBITDA of about ₹900 crore. My own calculation adds the audited-simple net debt, which includes leases, to market capitalisation and divides by trailing operating EBITDA, which gives about 24×. The two differ a lot, and I cannot reconcile the provider’s inputs: the gap may come from minority interests, lease treatment or a different EBITDA series. I therefore show both and rely on neither as a fair-value signal. [2][5][9]
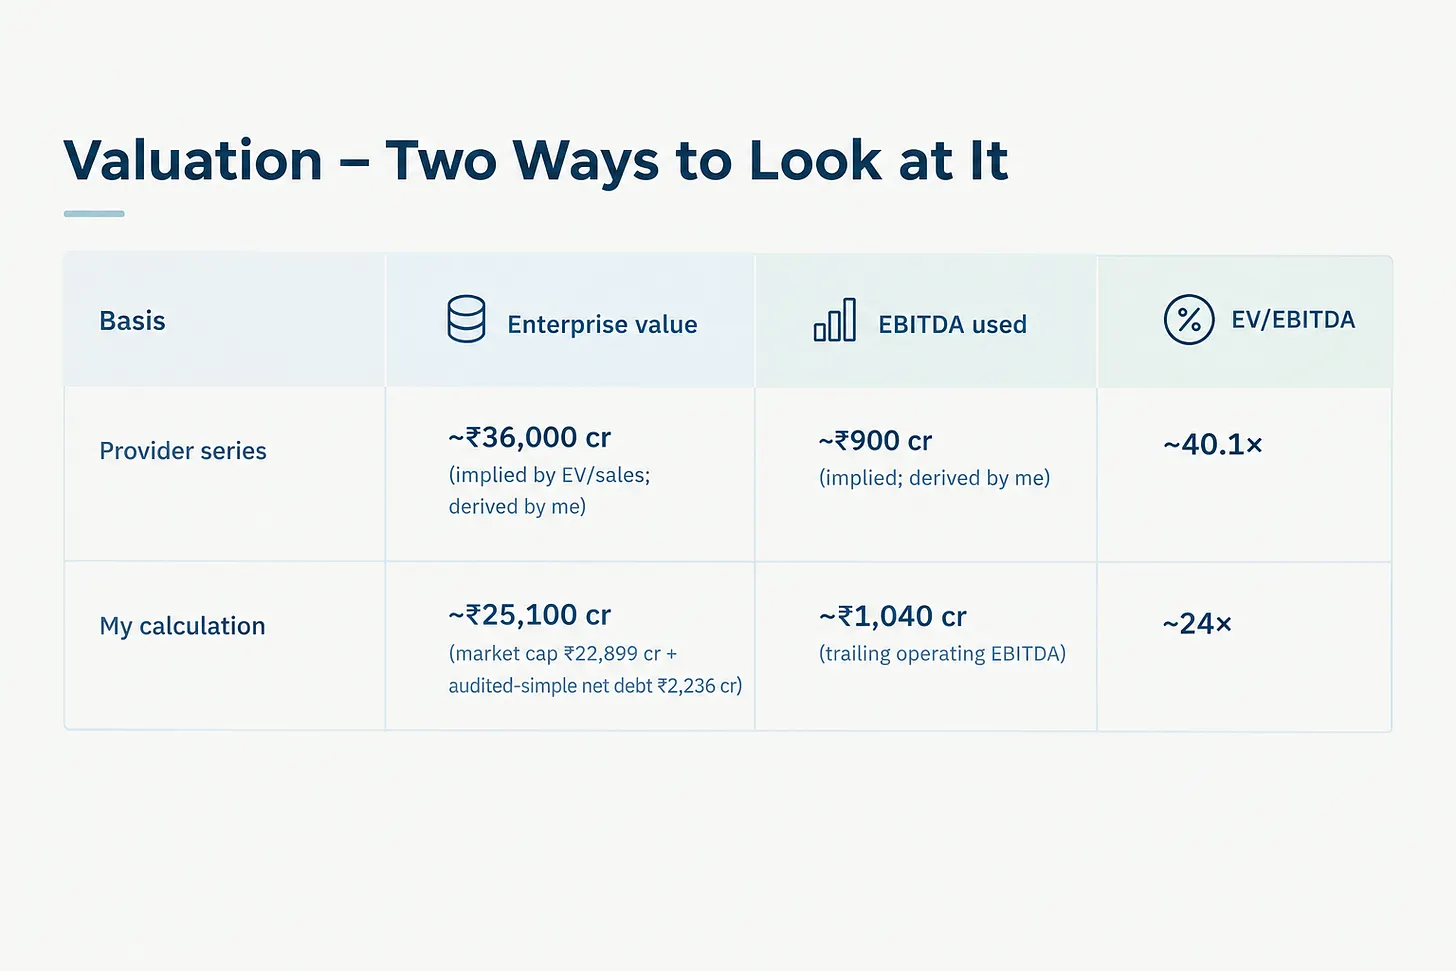
Trailing operating EBITDA = FY2026 ₹970 cr + Q1 FY2027 ₹337 cr − Q1 FY2026 ₹263 cr, about ₹1,044 cr. [2][4][5]
Earnings expansion required. Holding my enterprise value of about ₹25,100 crore constant, the table shows the EBITDA needed to bring the multiple down to lower levels. This is arithmetic to frame the growth already expected by the market, not a price forecast or fair-value target. [2][5][9]
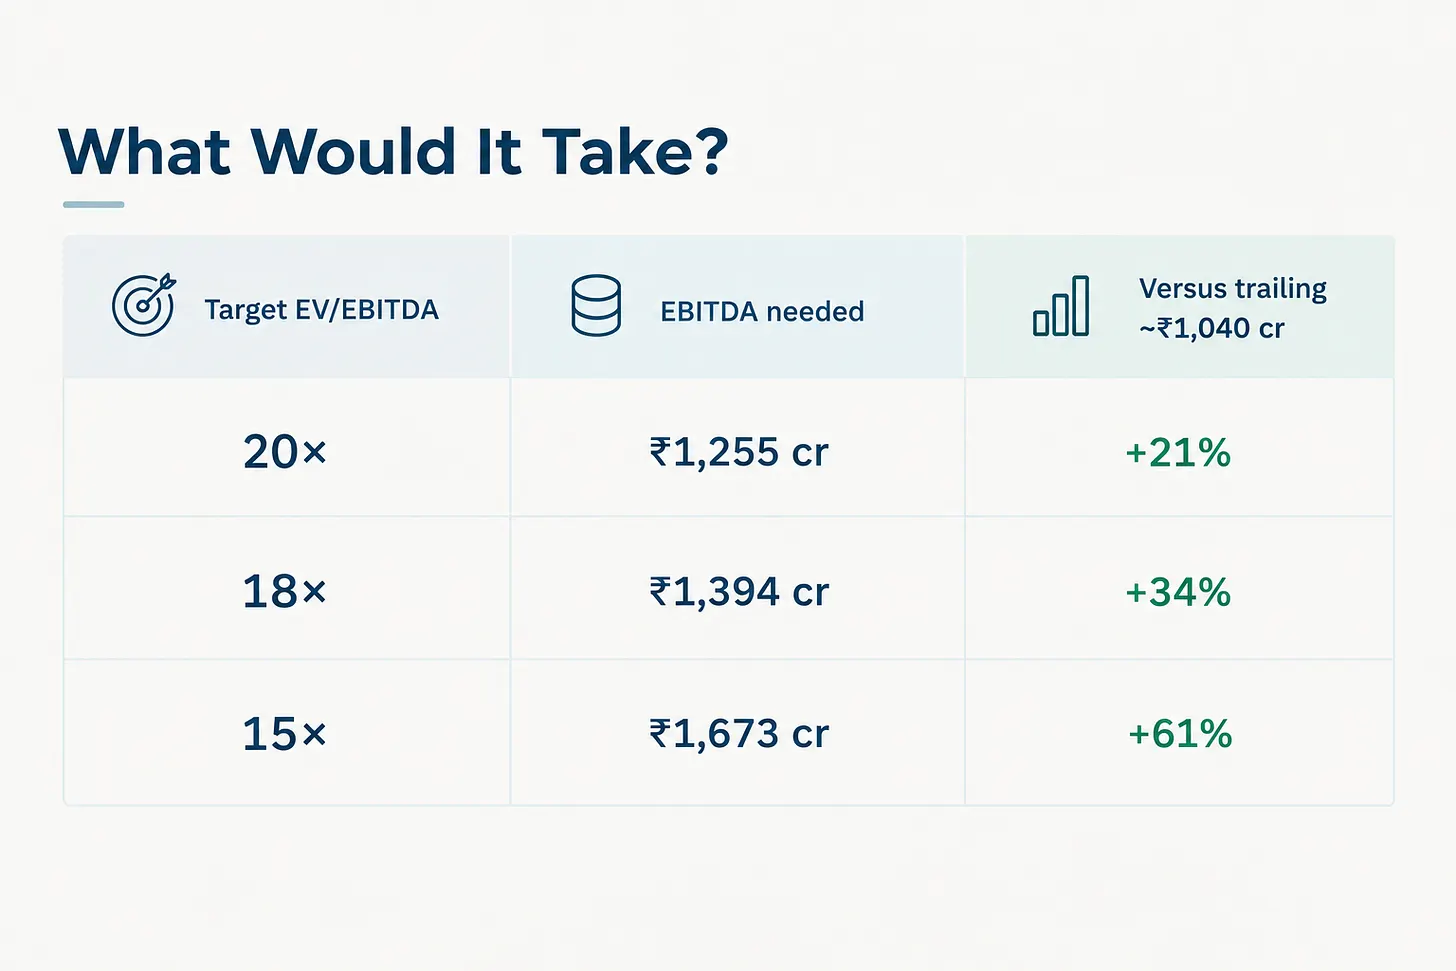
My reading is that the valuation looks demanding rather than obviously cheap. Amber trades at about 68× adjusted earnings, and at about 24× or about 40× EBITDA depending on the basis. On the provider basis used for all three companies, Amber sits below Dixon and PG Electroplast, but its returns on capital and recent cash conversion are weaker. A lower multiple on less cash-generative earnings is not automatically a discount. [9][11]
Risks and monitoring thresholds
Management-led risks
- Capital allocation: acquisitions and new facilities must convert into earnings, cash flow and adequate returns; Shivalik shows that related investments can disappoint. [1][2]
- Capacity utilisation: PCB, electronics and railway facilities require capital before full contribution; delays or weak customer onboarding can leave capacity underused. [5][6]
- Working capital: inventory planning, production scheduling, supplier terms and collections are partly within management’s control. [2]
- Governance and complexity: the audit qualification, related-party approvals and minority-interest structure require close disclosure monitoring. [1][2][7]
External risks
- Raw-material inflation, currency movements and supply-chain disruption can pressure margins, especially where pass-through is delayed or contracts are fixed-price. [5][6]
- Policy changes can alter project economics; government support also benefits competitors. [13]
- AC demand is seasonal and sensitive to weather, channel inventory and consumer spending. [6][8]
- OEM customers can change sourcing or inventory behaviour; the five largest customers accounted for 38% of group revenue in FY2025 per CRISIL’s latest comparable disclosure. [8]
- Railway projects face tender, approval and execution risk. The IL JIN fire adds operational and insurance-recovery uncertainty. [10]
Arthaay monitoring thresholds
These are my review criteria, not management guidance or universal rules. I would reassess the thesis when a trigger persists across reporting periods, rather than react to one weak quarter.
On the ROCE hurdle. ROCE is a pre-tax measure, whereas cost of capital is normally stated after tax. I assume a post-tax cost of capital of about 11% for an Indian capital-intensive manufacturer, which at a 25% tax rate is roughly a 15% pre-tax ROCE. This is an analytical assumption, not a company-disclosed target. Amber’s own FY2025 provider ROCE of 14.0% was already slightly below it, so meeting the hurdle would need returns better than before the current expansion.
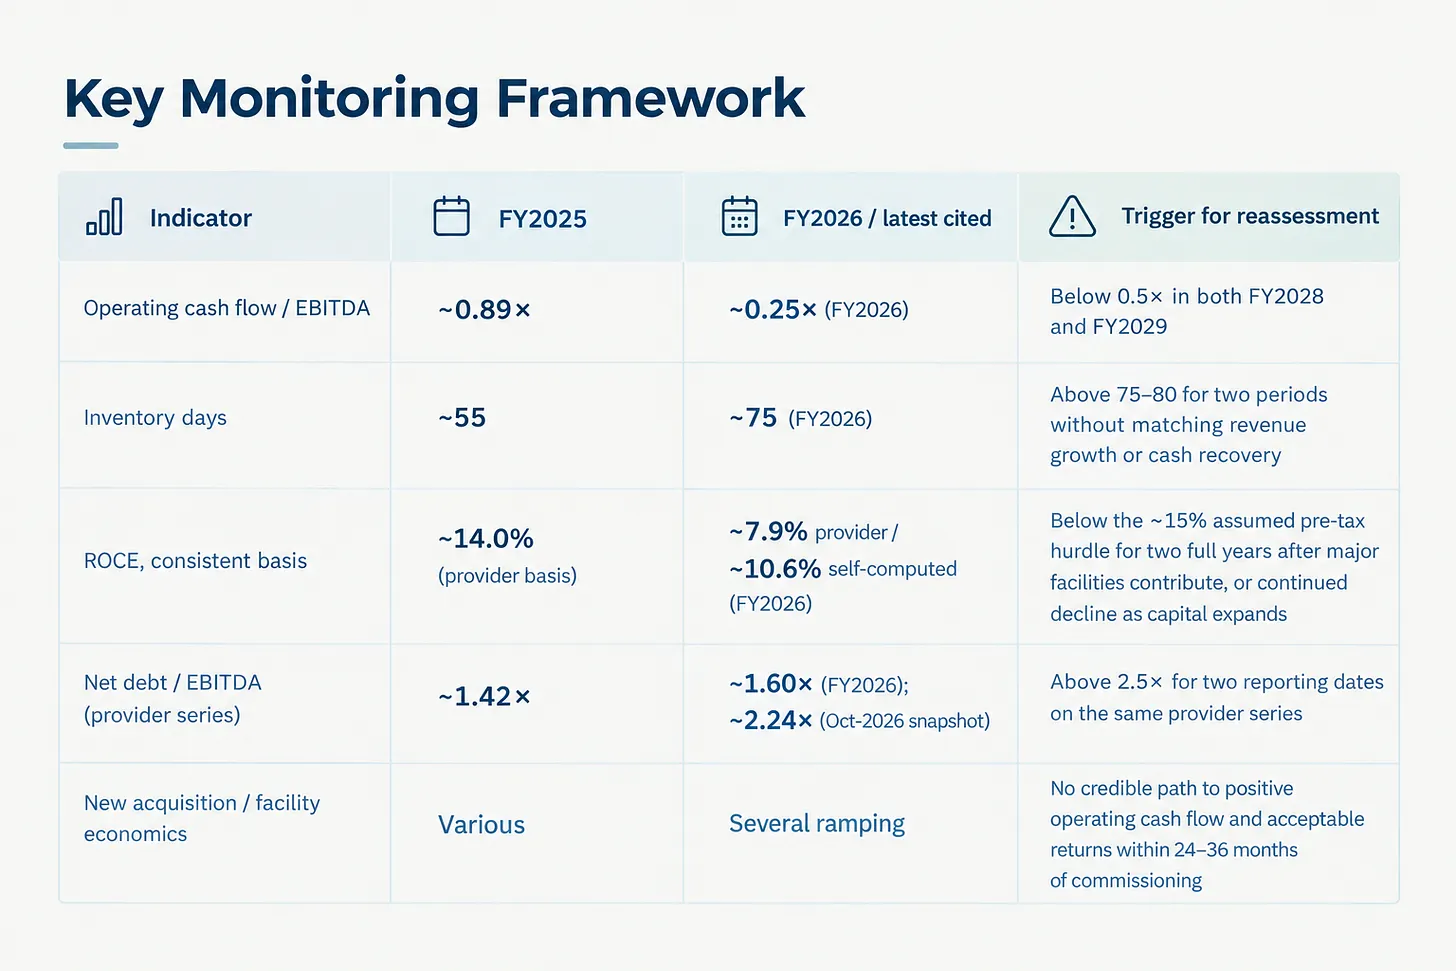
The FY2026 and October 2026 net-debt/EBITDA readings are separate observations in the provider’s standardised series, not a reconciled company-reported time series. The 2.5× trigger is a conservative review threshold, not a company-defined covenant. [5][9]
The net debt/EBITDA trigger is the one I would watch first: the October 2026 reading of about 2.24× is already close to 2.5×, up from about 1.60× at FY2026 year-end, with about ₹4,700 crore of PCB projects still to be funded.
Conclusion
Amber has built a credible manufacturing platform through backward integration, customer relationships and capability reuse. Consumer Durables provides scale, Electronics offers the clearest growth opportunity, and Railway Sub-systems & Defence adds specialised products and customer-qualification barriers. [1][5][15]–[19]
The financial evidence is mixed. Revenue and operating EBITDA grew in FY2026, but operating cash flow fell, capex exceeded operating cash flow, inventory days rose and returns on capital weakened. The next phase must show that new facilities and acquisitions can turn capacity into earnings, cash generation and adequate returns. [2][9]
My judgement is constructive on Amber’s strategic direction, but I would not treat strategic coherence as proof of successful capital allocation. The enlarged platform needs to generate durable cash flow, higher returns on capital and value for all shareholders, not simply become a larger group.
What would strengthen the view
- Operating cash flow recovers relative to EBITDA as major facilities ramp up.
- Inventory days stabilise or decline while revenue grows.
- Return on capital rises toward or above the ~15% assumed pre-tax hurdle on a consistent calculation basis.
- Net debt stabilises on management’s reported series while EBITDA and cash flow improve.
- Power-One, Unitronics, Shogini and advanced PCB facilities show sustained profitability and a credible path to attractive returns.
- The audit qualification is resolved or clearly explained.
- Governance disclosures remain clear on related-party dealings, intercompany balances and minority interests.
What would weaken the view
Beyond the numerical triggers above, my view would weaken if Amber keeps expanding its asset base without improving cash conversion and returns; if newer acquisitions repeatedly require more capital without operating progress; or if audit, related-party and minority-interest disclosures remain unclear. These are reasons to reassess the thesis, not automatic sell signals.
Appendix A: Why the debt figures differ
The figures below use different definitions and dates. They should not be added together or treated as one reconciled series. The audited notes identify approximately ₹1,329 crore of deposits, bonds and other liquid treasury assets that management nets against borrowings. [2][5]
The bridge: ₹2,306 cr borrowings − ₹466 cr cash and bank balances − ₹1,329 cr deposits, bonds and other treasury assets = ₹511 cr, management’s figure. Lease liabilities (₹396 cr) are excluded from that series; adding them and not netting the ₹1,329 cr gives the audited-simple ₹2,236 cr. [2][5][22]
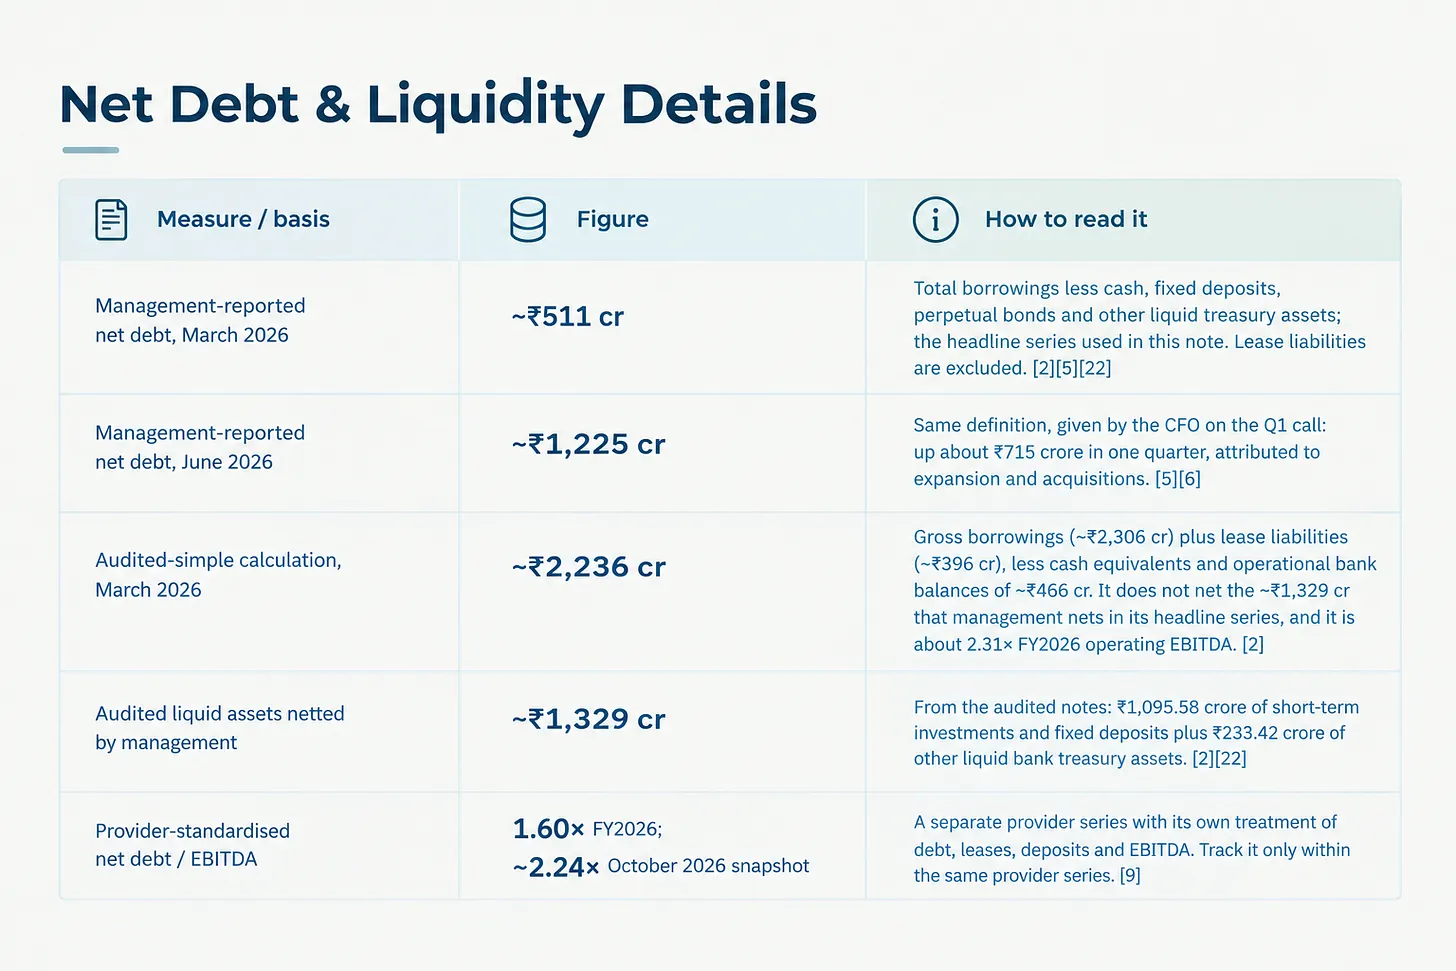
I treat management-reported net debt as one tracking series, the audited-simple bridge as a sensitivity, and the provider leverage as a separate series. None is a covenant-style figure. [1][2][5][9][22]
Appendix B: Technical terms
Source register
- [1] Amber Enterprises: Financial Information archive and FY2025–26 Annual Report — https://www.ir.ambergroupindia.com/financial-information/
- [2] Amber Enterprises: FY2025–26 audited financial results and auditor’s report — https://www.ir.ambergroupindia.com/wp-content/uploads/2026/05/Financial-Results-Q4-FY-26-15.05.2026.pdf
- [3] Amber Enterprises: FY2026 results press release and adjusted-PAT disclosure — https://www.ir.ambergroupindia.com/wp-content/uploads/2026/05/Press-Release-Q4FY26-16.05.2026.pdf
- [4] Amber Enterprises: Q1 FY2027 financial results — https://www.ir.ambergroupindia.com/wp-content/uploads/2026/08/Financial-Results-Q1-FY27.pdf
- [5] Amber Enterprises: Q1 FY2027 investor presentation — https://www.ir.ambergroupindia.com/wp-content/uploads/2026/08/Investor-Presentation-%E2%80%93-Q1-FY-2026-27.pdf
- [6] Q1 FY2027 earnings-call transcript (third-party reproduction of management’s call) — https://www.investing.com/news/transcripts/earnings-call-transcript-amber-enterprises-posts-strong-q1-2026-growth-93CH-4859723
- [7] Amber Enterprises: 36th AGM voting results, 16 September 2026 — https://www.ir.ambergroupindia.com/wp-content/uploads/2026/09/SE-Intimation-Voting-Results-Sep-2026.pdf
- [8] CRISIL: Amber Enterprises rating rationale, December 2025 — https://www.crisil.com/mnt/winshare/Ratings/RatingList/RatingDocs/AmberEnterprisesIndiaLimited_December%2010_%202025_RR_384918.html
- [9] StockAnalysis: Amber Enterprises financial ratios (snapshot dated 9 October 2026) — https://stockanalysis.com/quote/nse/AMBER/financials/ratios/
- [10] Amber Enterprises: IL JIN fire incidence intimation, 4 August 2026 — https://www.ir.ambergroupindia.com/wp-content/uploads/2026/08/SE-Intimation-IL-JIN-Fire-Incidence-04.08.2026.pdf
- [11] StockAnalysis: PG Electroplast financial ratios — https://stockanalysis.com/quote/nse/PGEL/financials/ratios/
- [12] Screener: Dixon Technologies financials and ratios — https://www.screener.in/company/DIXON/
- [13] Government of India: Electronic Component Manufacturing Scheme (ECMS) information — https://www.pib.gov.in/PressReleasePage.aspx?PRID=2291171&lang=1®=1
- [14] Amber Enterprises: historical company introduction presentation — https://www.ir.ambergroupindia.com/wp-content/uploads/2025/03/Amber-Introduction-Presentation-December-2020.pdf
- [15] Amber Enterprises: Sidwal acquisition presentation, March 2019 — https://www.ir.ambergroupindia.com/wp-content/uploads/2025/03/Acquisition-Presentation-March-2019.pdf
- [16] Amber / IL JIN: Ascent Circuits acquisition announcement — https://www.ir.ambergroupindia.com/wp-content/uploads/2025/03/Press-Release-on-Acquisition-of-Ascent-Circuits-by-ILJIN-03.01.2024.pdf
- [17] Amber / IL JIN: Power-One acquisition press release — https://www.ir.ambergroupindia.com/wp-content/uploads/2025/06/SE_Intimation_Press-Release.pdf
- [18] Amber / IL JIN: Unitronics acquisition announcement — https://www.ir.ambergroupindia.com/wp-content/uploads/2025/07/Press-Release_Amber_Unitronics-28.07.2025.pdf
- [19] Amber / IL JIN: Shogini Technoarts acquisition disclosure — https://www.ir.ambergroupindia.com/wp-content/uploads/2025/11/SE-Intimation-of-Shogini-IL-JIN-Agreement-to-Acquire-14.11.2025.pdf
- [20] Screener: Amber Enterprises consolidated financials and ratios — https://www.screener.in/company/AMBER/consolidated/
- [21] FinBlab: Q4 FY2026 results summary with management speech on adjusted PAT (third-party summary, not an Amber document) — https://www.finblab.com/amber-enterprises-q4-fy2026/
- [22] Amber Enterprises: Q2 FY2023 result presentation (source of management’s net-debt definition) — https://www.bseindia.com/xml-data/corpfiling/AttachHis/7881f5ca-91f1-49b3-b05b-5e918c91dcf9.pdf
- [23] Q4 FY2026 earnings-call transcript (third-party reproduction of management’s call) — https://alphastreet.com/india/amber-enterprises-india-limited-amber-q4-2026-earnings-call-transcript/
- [24] Business Standard: report on the joint venture with a Korean company (Korea Circuit) — https://www.business-standard.com/s/2dZhxFY
- [25] Amber Enterprises: ECMS approval intimation for the Ascent-K Circuit facility — https://www.ir.ambergroupindia.com/wp-content/uploads/2026/01/SE-Intimation-ECMS-Approval.pdf
Figures are rounded. Company-reported segment results, management-presented divisional operating EBITDA and third-party standardised ratios are different measures. Market ratios are dated snapshots.
Disclaimer
This research report is for the informational use of the recipient and does not constitute an offer, solicitation or recommendation to buy or sell any security. It is based on publicly available information believed to be reliable as of the stated cut-off date, but no representation is made as to its completeness or accuracy. Investors should conduct their own research and consult a qualified financial adviser before making investment decisions.
Arthaay is not registered with SEBI as a Research Analyst or Investment Adviser. This note is for educational and informational purposes only and does not constitute personalised investment advice, an offer or a recommendation to buy, sell or hold any security.